


Create Grid from Points
Purpose
The tool is meant for creating grids from point data interpolating input points by values from the selected attribute field.
Description
Grid is a geographic representation of the world as an array of cells arranged in rows and columns. Each grid cell is referenced by its geographic X, Y location. Raster cell is a discretely uniform unit (square or rectangle) that represents a portion of the earth such as a square meter or square mile. Each pixel has a value that corresponds to the feature or characteristic at that site such as a soil type, census tract, or vegetation class.
With the Create Grid from Points tool you can create grids from point data interpolating input points by the specified field values. In this tool interpolation is performed by creating analytical splines using various provided methods.
Usage
-
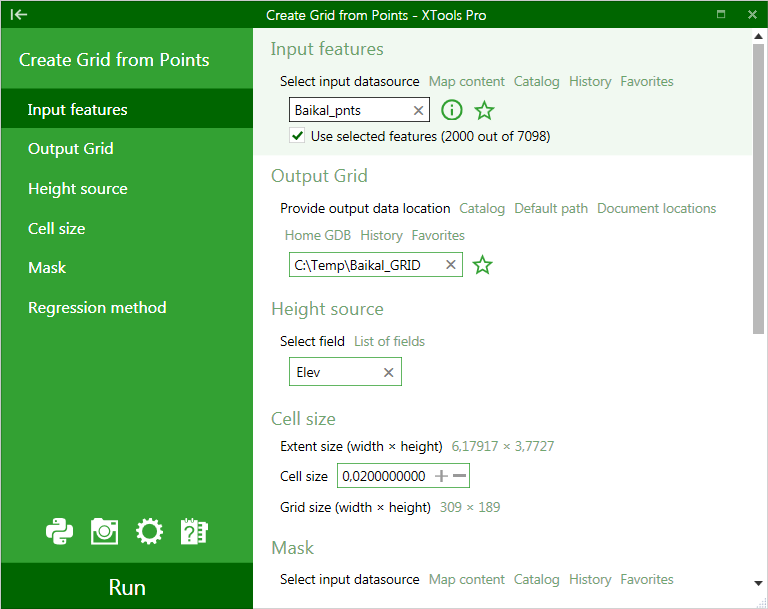
Select the "Convert Grid from Points" tool from the XTools Pro Surface Tools menu.
-
Select the input layer containing points that you wish to create Grid from.
-
Specify output Grid dataset. Following formats are supported for storing new Grids: Esri GRID, EDRAS IMAGINE and TIFF.
-
Select an attribute field for use as a Height source.
-
Select output Grid cell size.
-
Specify a mask polygon layer if required. If the mask is selected then output Grid will be generated only within the mask area.
-
Select regression method.
-
Press Run to create a new Grid.
Interpolation parameters.
The input points are interpolated by creating an analytical spline in 3D. This analytical spline can be created using the following regression methods:
• Linear Radial with Constant Tending
- The pseudo-linear radial basic function and a polynomial kernel of the 0th degree are used. We call this spline as the pseudo-linear spline with constant kernel. This spline tends to a constant along any ray.
• Linear Radial with Linear Tending
- The pseudo-linear radial basic function and the polynomial kernel of the 1st degree are used. We call this spline as the pseudo-linear spline with linear kernel. This spline tends to a linear function along any ray.
• Quadratic Radial with Linear Tending
- The pseudo-quadratic radial basic function and the polynomial kernel of the 1st degree are used. We call this spline as the pseudo-quadratic spline with linear kernel. This spline tends to a linear function along any ray.
• Cubic Radial with Linear Tending
- The pseudo-cubic radial basic function and the polynomial kernel of the 1st degree are used. We call this spline as the pseudo-cubic spline with linear kernel. This spline tends to a linear function along any ray.
• Multi Linear Positive Definite
- The info class for analytic multi-linear spline. Multi-linear spline is constructed using a mesh of points, a positive-definite reproducing function G(x, y) = Prod(g(xi, yi)), and a polynomial kernel of the given degree. Here g(u, v) = 1 + (|u| + |v| - |u - v|) / 2. Calculations of first-order differential functionals are forbidden for this spline.
While the interpolation method is the main parameter affecting the output Grid, there are other parameters to be specified as well.
• Quality
- This parameter defines interpolation quality and directly impacts on the interpolation time. When there is a reasonably great number of input points available you can vary the calculation accuracy by filtering out the less representative points. At that, 100% Quality (default value) provides the maximum accuracy, takes into account all input points and maximum time. The minimum Quality value is 75%.
• Mean neighbours
- This parameter defines the mean number of neighbouring points taken into account for interpolating a value in an unmeasured location.
• Outlier probability
- This is the threshold value of the probability that a separate value of the interpolated points is an outlier. Input points with high outlier probability are disregarded in interpolation.
---